Anyone who has followed advanced stats work for the NHL will likely be familiar with discrepancies in how shots have been tracked at different rinks. Most notably, the folks at MSG were especially kind to goaltenders in the early days of event data. With the PWHL on hiatus for the Worlds, it seemed like an opportune time to see if we have any similarly goalie-friendly rinks.
Fortunately, we don’t have to rely on home/away splits or any type of modeling. Mike Murphy, John Bouchard, and Gilles Dignard have been doing different types of tracking this season.
Relevant to us, one of the things Gilles has been tracking is shot events. So we can directly compare his data to the PWHL’s. As long as Gilles has been reasonably consistent in how he has recorded things, it should show where the PWHL trackers have been more or less generous.
In case anyone wants to check out the league’s data, Ben Howell has added the PWHL to fastRhockey. I didn’t use it for this, but if anyone reading this is looking, I figured it was worth shouting out.
Shot Counts
We’ll start by looking at how many shots are being recorded. The neutral site games have been omitted and I’ve grouped games from different home rinks together.
Gilles has been recording all shot attempts, while the league only has shots on net. Well, it has some blocked shots, but those haven’t been recorded consistently. So we’ll drop the blocks and misses and see if anyone’s padding the on-net counts for their home games. Whenever comparing the two, I’m going to use (P)urple to represent (P)WHL and (G)reen to represent (G)illes.
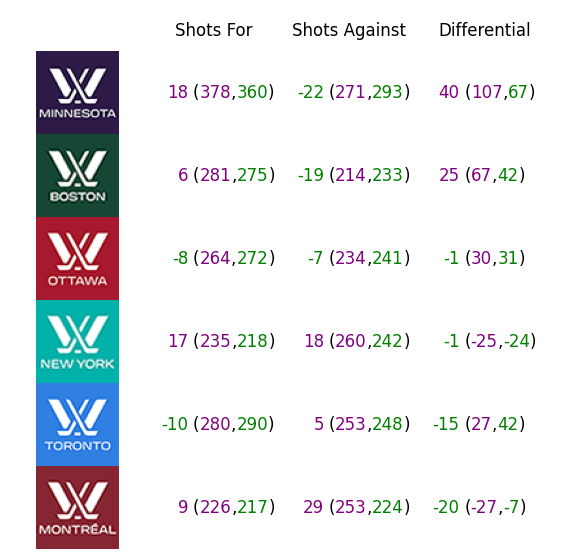
When it comes to counts, goalies are once again appreciative of the folks in New York. But at least there doesn’t seem to be a home bias in those numbers. Minnesota, on the other hand, might be exaggerating their team’s performance a wee bit. Meanwhile, Montreal really wants to believe that Desbiens is stopping everything, while Boston is downplaying Frankel’s work.
Most of Toronto’s difference can be attributed to a single game. Their January 17 matchup with Boston had the shots as 32-22 compared to 38-18. At the other end of the spectrum, Boston only gave Minnesota 21 shots in their January 27th game while Gilles had them at 32. Both had Boston at 15. That was one of the few games Emma Soderberg got into, so maybe it isn’t Frankel getting shorted.
Shot Locations
Now that we know who may be padding the numbers, let’s see where those extra shots are winding up. In each of these, shots against are on the left, shots for are on the right. Let’s start with the darkest purple.

Minnesota showing the most purple. How appropriate. They’re recording a lot more shots in tight, especially for the home side. Though, the slot shots being up isn’t unique to Minnesota. Montreal, New York, and Toronto all show some extra close-ups to different degrees.
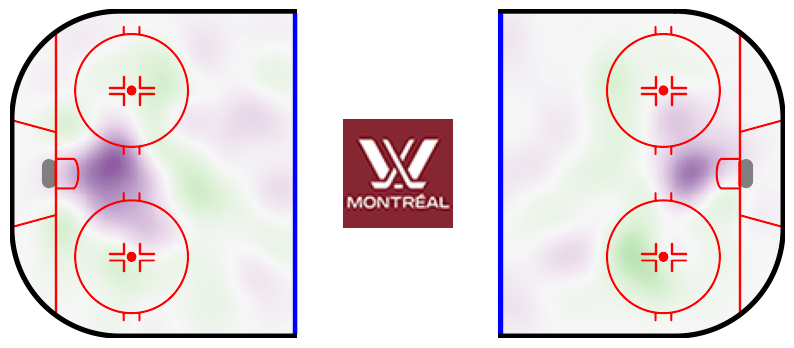

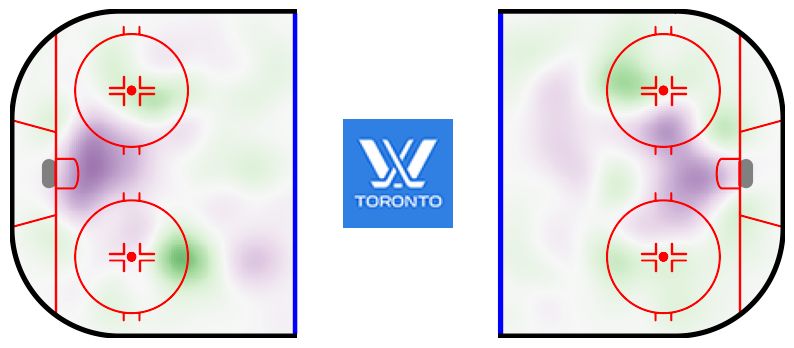
This got me curious if it was a case of some extra rebounds getting counted. Overall, the PWHL records more shots within 2 seconds of the previous (145 to 118), but the difference gets wiped out if we extend it to 3 seconds (168 to 169). Using a 3 second cutoff, New York has recorded an additional 17 rebounds (for either team), but Minnesota’s only 7 over and Montreal 5. Toronto actually has 8 fewer recorded while Ottawa and Boston have 9 and 13 fewer respectively.
In general, I don’t think it’s an issue, but New York may be counting some pad-whacking as shots.
Another thing worth considering is that the PWHL is using a bit of an odd coordinate system for recording events.
Most likely, they’re using an Olympic-sized (200x100ft) rink image and zooming in to three times its size. That would cause some of the rink features to be in slightly different spots. Some of the differences in shooting location could just be an artifact of the difference in where reference points are found on the image. I wouldn’t expect the crease to be one of those, but when compressing the y-coordinate to an 85 foot rink, we’re moving things inward uniformly. Shots toward the middle of the ice are more likely to already be in the right vicinity before we push them even more to the middle. Maybe that’s contributing to the congestion.
Anywho, let’s take a look at Ottawa next.
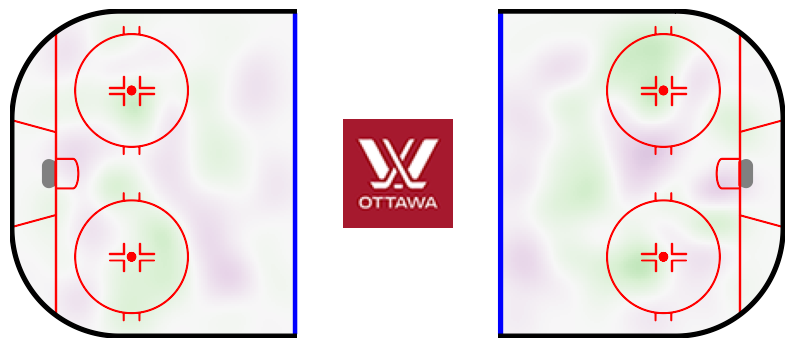
Between the close count numbers and this, I think we can say whoever’s recording things for Ottawa sees things pretty similar to Gilles.
And finally, here’s Boston.
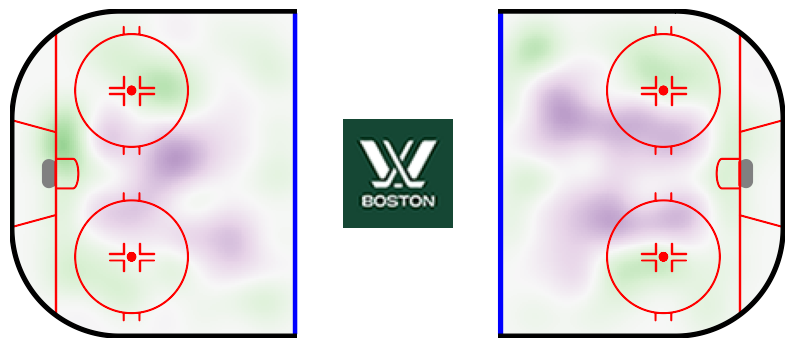
Boston is kind of curious because they’re the only ones not recording more shots in tight. As I mentioned in my last post, the PWHL rinks aren’t of uniform shape. I haven’t looked through all of them, but Tsongas Center (where Boston has played all their home games) is unique in one specific characteristic.
Playing around with my annotator, I decided there must be 15 feet below the goal line.
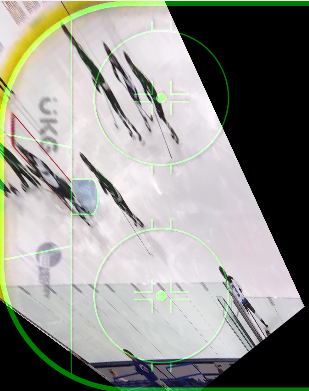
Apparently, that’s the most space you’re allowed back there in college hockey.
That got me wondering if maybe the extra space below the goal line was being accounted for in the PWHL shots. That could explain why the extra shots are pushed out a little from the net compared to the other teams. So let’s go ahead and compare the shot locations on a standard rink to one where we move the goal line out.
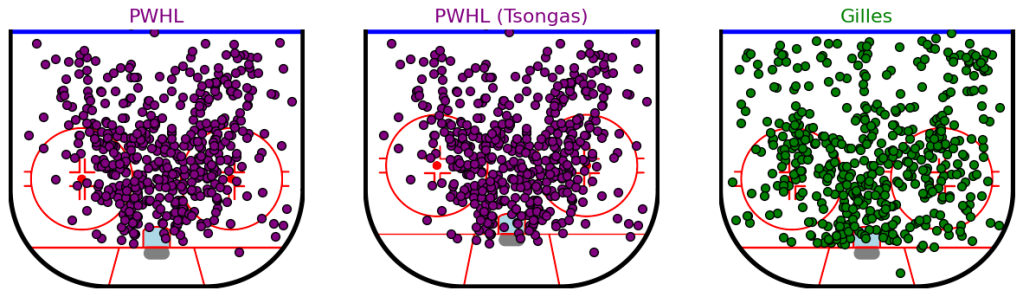
As interesting as it would be to have a shot recorded from inside the net, I’m thinking this probably isn’t the cause. I can’t rule it out, but it’s more likely that they just don’t think anyone’s getting to the blue paint.
xG
Finally, let’s look at how this could affect xG totals. We can use the PWHPA data Sportlogiq provided to last year’s WHKYHAC to train a model and apply it to our shots. I decided to go extremely simple and only use the shot’s location for this, brashly disregarding even something as simple as strength-state.
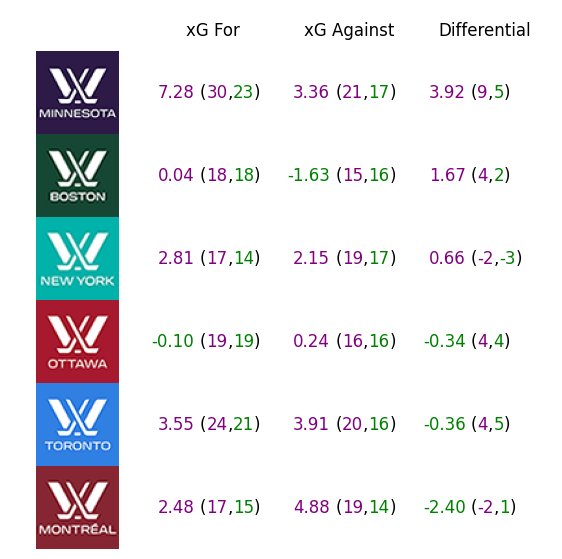
As a reminder, these are only home ice results. The model is underpredicting goals in general, but it actually overpredicts on the training set. I guess the PWHL is a higher scoring environment than the PWHPA was. Or Sportlogiq records shots-on-net differently.
Anyway, this should give us an idea of which way to hedge on the PWHL data. Minnesota may not be quite the offensive juggernaut that the kind folks doing the tracking make them out to be and the folks in Montreal may have found a subtle way to express their Ann-Renée Desbiens fandom.
